The BNMA BN Repository
This repository is a resource for posting and downloading Bayesian network models for sharing with others and for providing supporting material for publications. Please respect authors' rights where noted.
Search
72 BNs found.
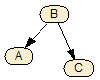
Separable 1
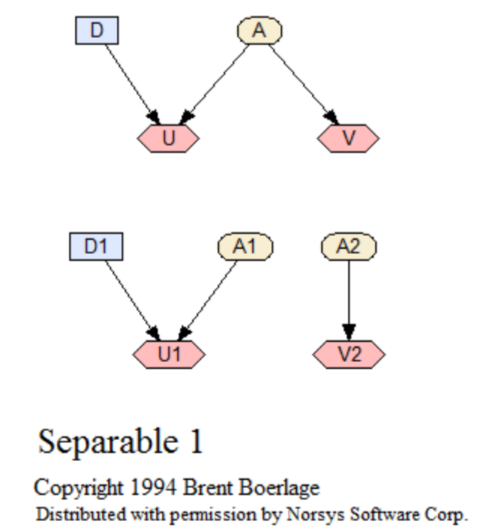
The simplest example of a separable (termed 'abnormal' by Zhang) decision net, and the 2 nets it can be separated into. This network shows only dependencies, and does not include any numerical relationships.
BN link: <www.norsys.com...>
Reactor
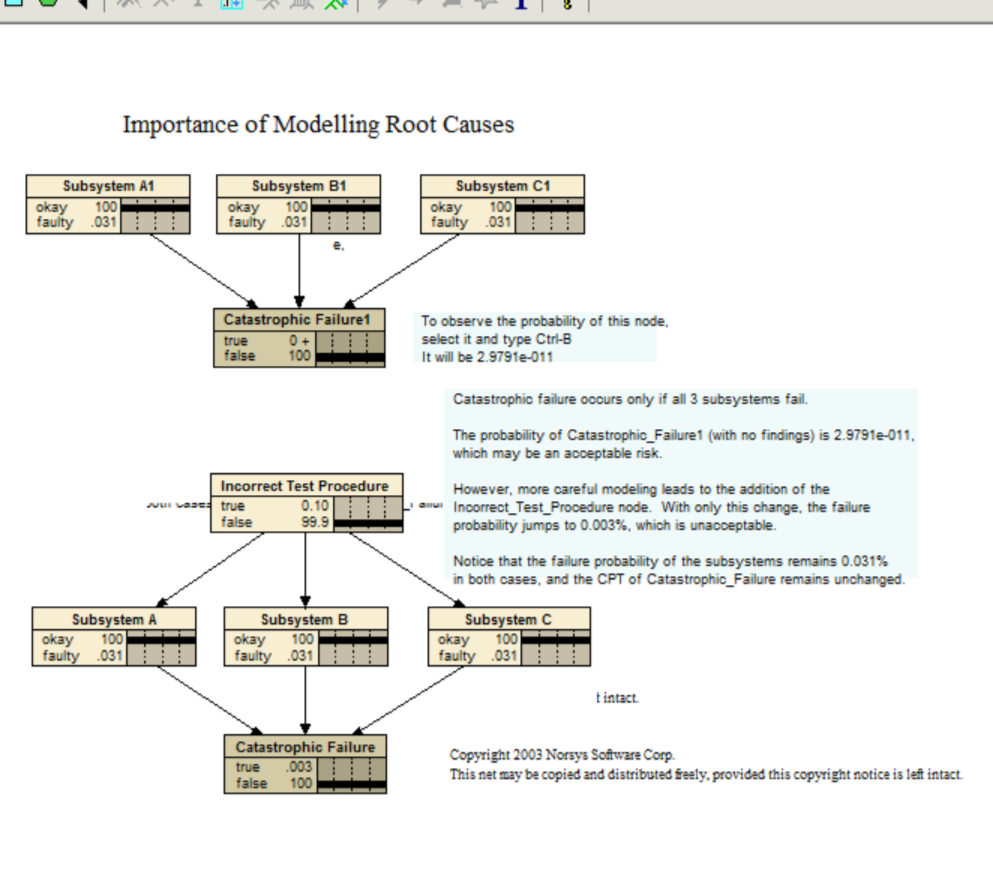
This example shows that introducing a common cause can make an important change, even if the maringal probabilities of the children remain the same.
Catastrophic failure occurs only if all 3 subsystems fail.
The probability of Catastrophic_Failure1 (with no findings) is 2.9791e-011, which may be an acceptable risk.
However, more careful modeling leads to the addition of the Incorrect_Test_Procedure node. With only this change, the failure probability jumps to 0.003%, which is unacceptable.
Notice that the failure probability of the subsystems remains 0.031% in both cases, and the CPT of Catastrophic_Failure remains unchanged.
BN link: <www.norsys.com...>
Pathfinder
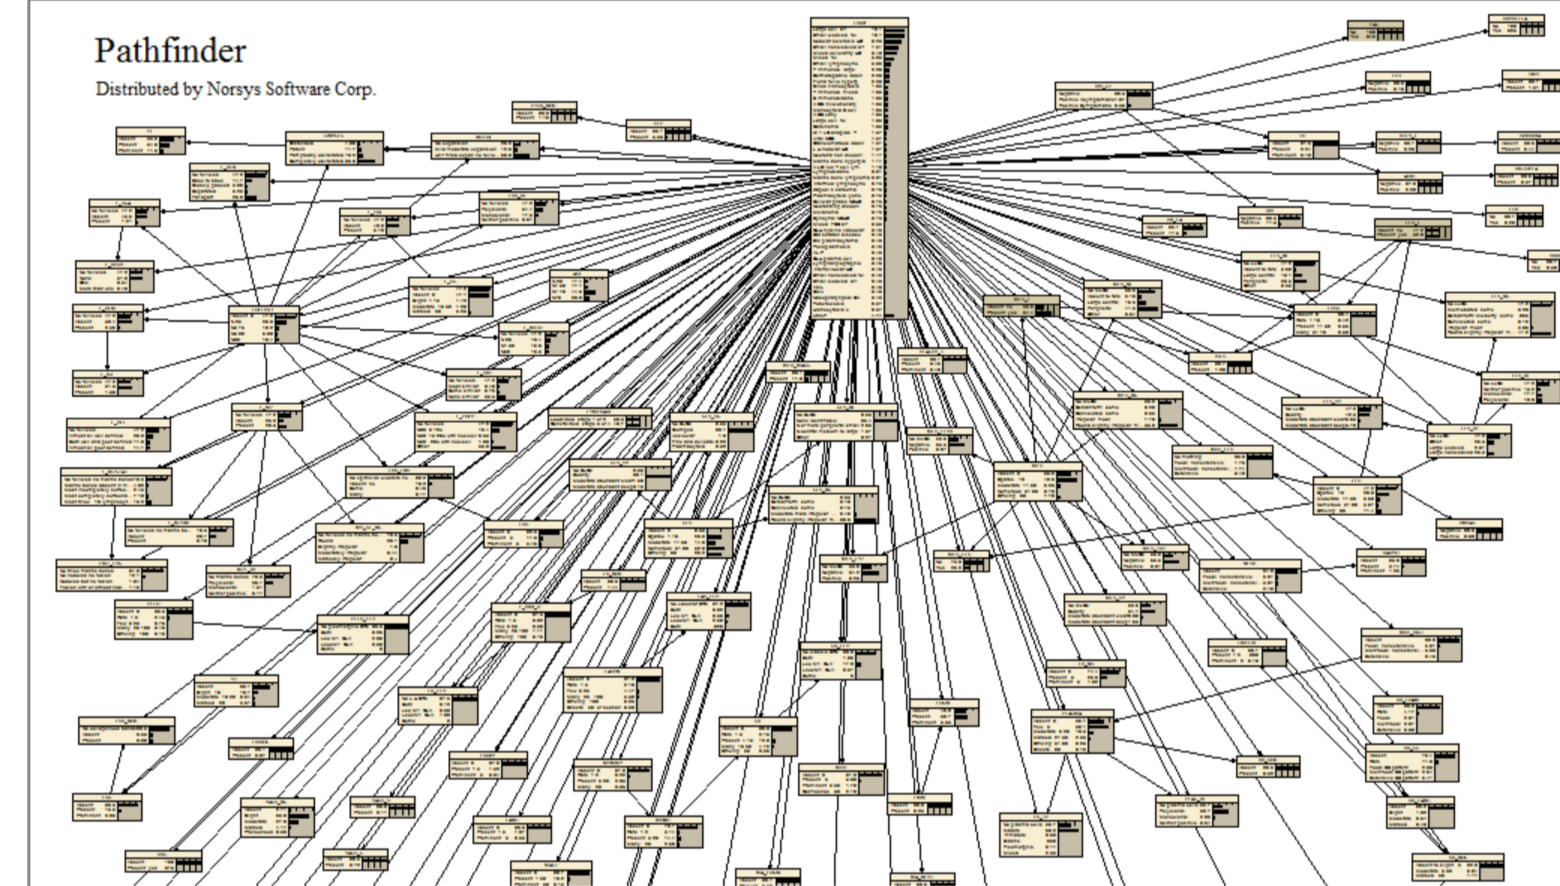
An expert system that assists surgical pathologists with the diagnosis of lymph-node diseases.
Paper link: <www.norsys.com...>
Oil Wildcatter Simplified
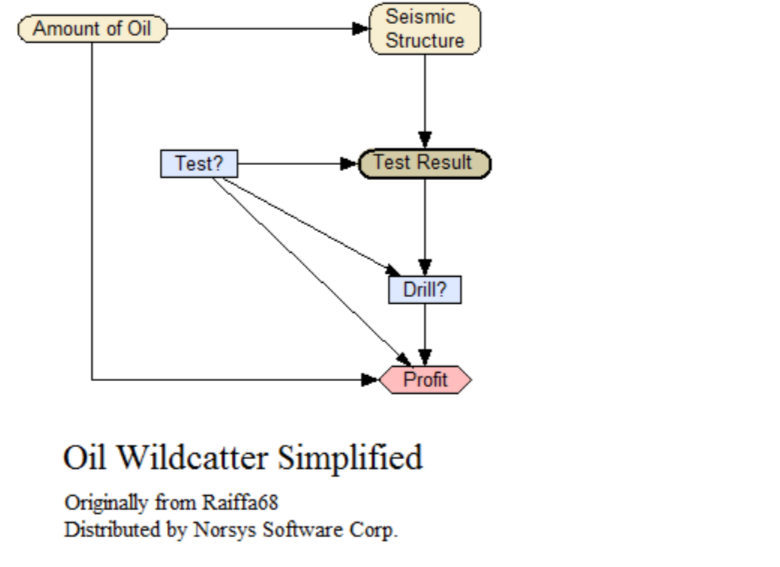
An influence diagram with decisions of whether to do seismic tests for oil, and whether to drill for oil, in order to maximize profits. Same as Oil_Wildcatter, but with some nodes absorbed ('summed out'). In wide usage, but originally from Raiffa68.
Paper link: <www.norsys.com...>
Neapolitan90
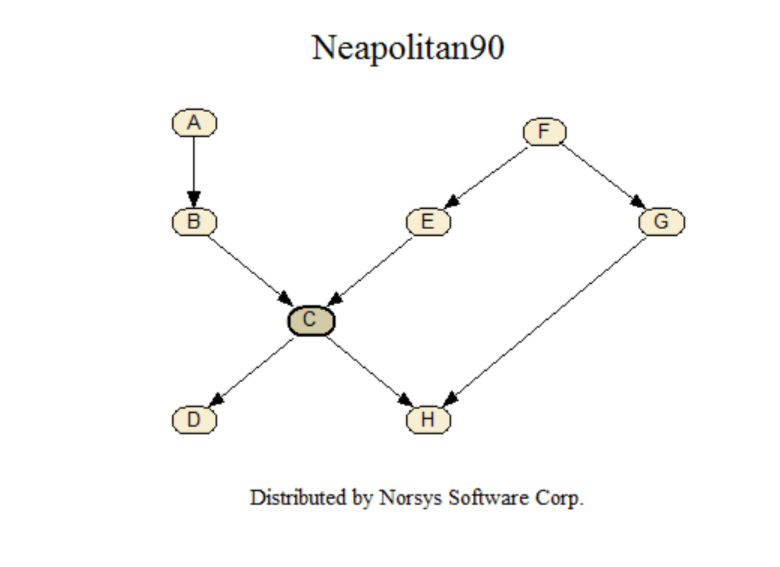
From the book Neapolitan, Richard E. (1990) Probabilistic Reasoning in Expert Systems: Theory and Algorithms, John Wiley & Sons, New York, p. 259. Started as problem 5.5.2, p.183, it becomes example 7.5, p. 261 (with diagram on p. 259), and continues numerically on p. 279. Originally based on the Lauritzen & Spiegelhalter 1988 paper.
BN link: <www.norsys.com...>
Mendel Genetics
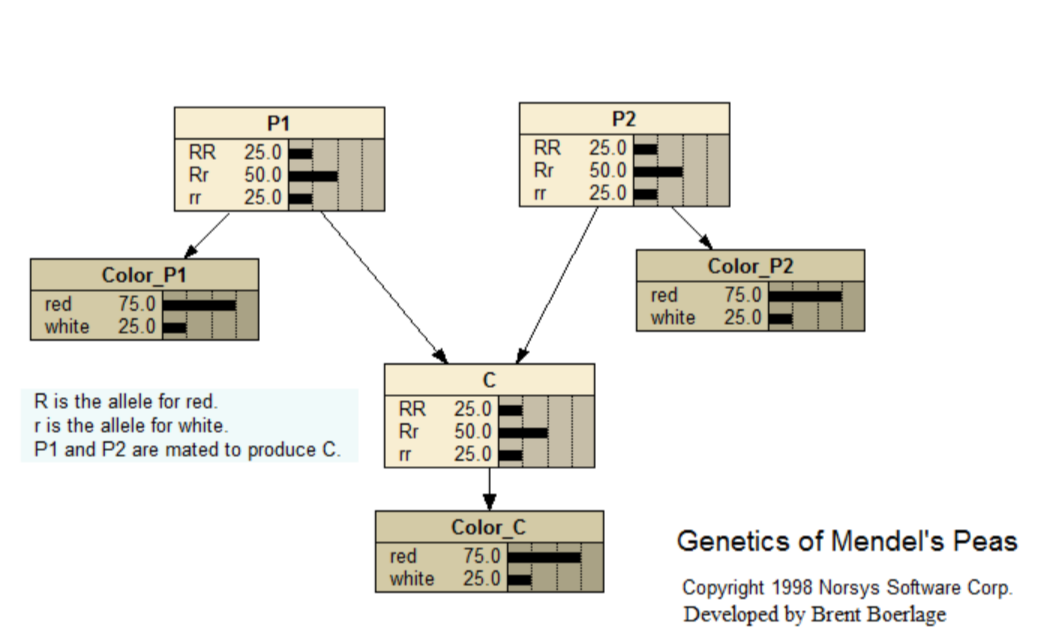
This Bayes net is for the famous experiments of Mendel, in which he developed the foundations of hereditary genetics. The experiments involved breeding red and white flowered pea plants.
A tutorial, with a complete description, is available at <www.norsys.com...>
Paper link: <www.norsys.com...>
Learn Latent
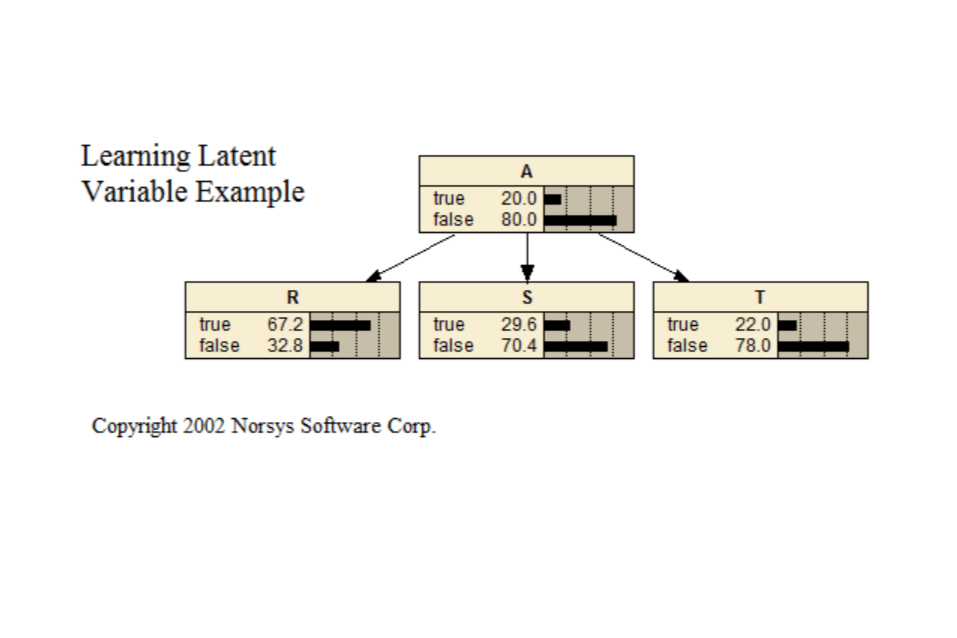
This Bayes net demonstrates learning a latent (or "hidden") variable, which occurs when you have an important node in the net for which no data appears in the case file.
Paper link: <www.norsys.com...>
Imposs Demo
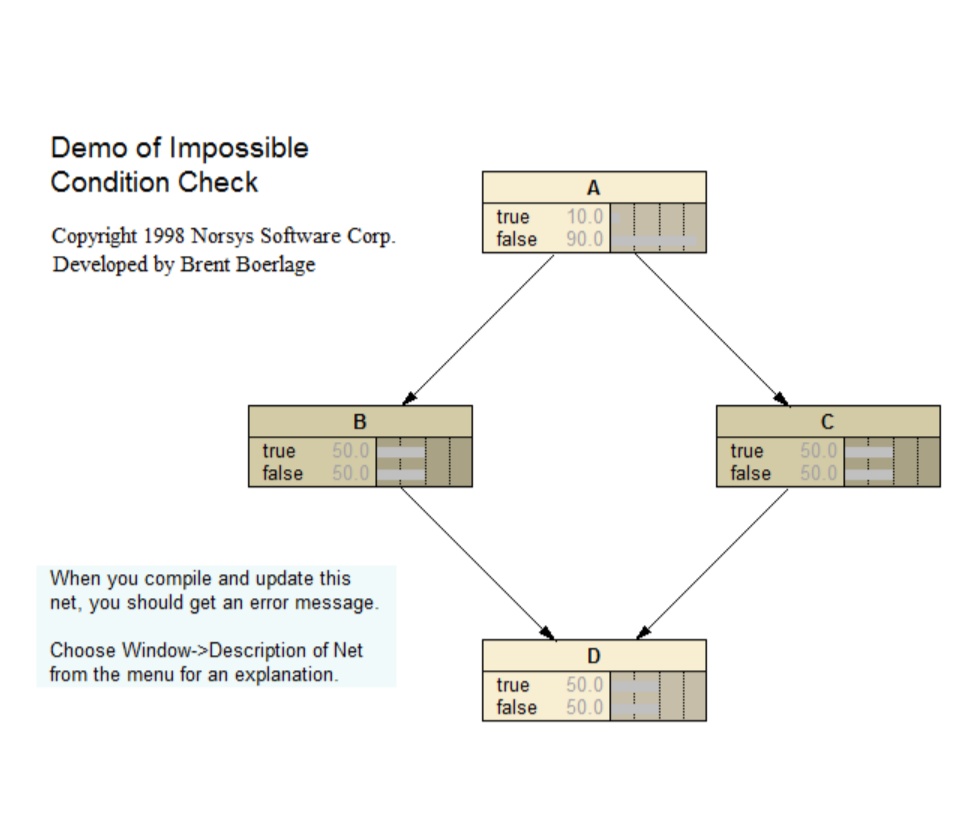
Demo of the impossible condition check. Refer to the following link for a description and tutorial of the BN: <www.norsys.com...>
Paper link: <www.norsys.com...>
False Barrier
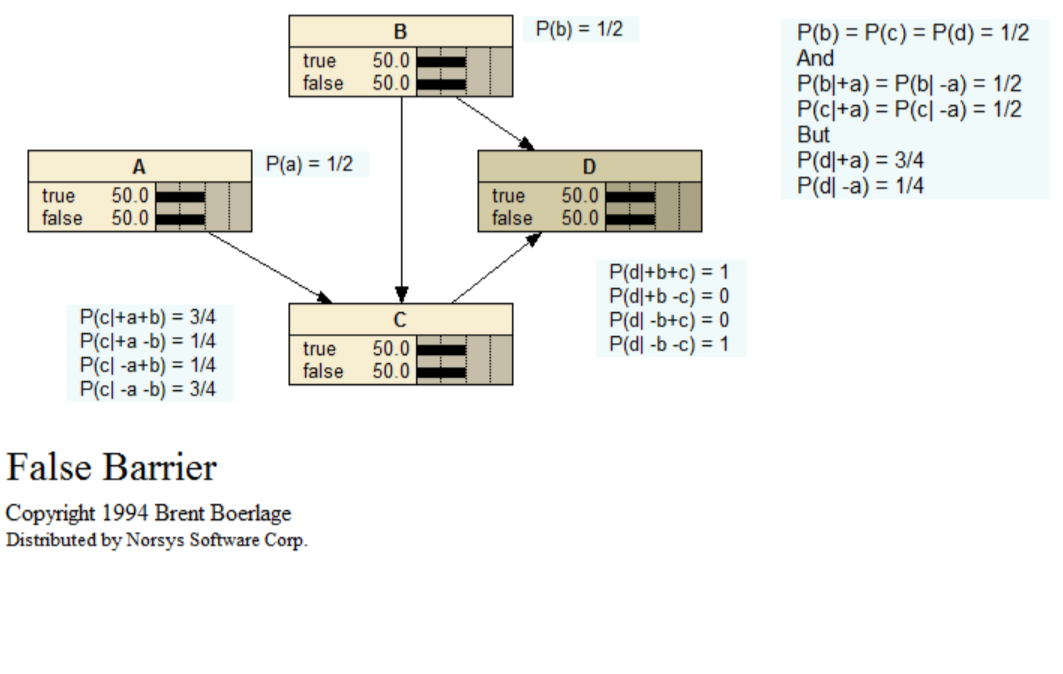
In order to express the belief in a node as a function, it must be expressed as a function of the joint beliefs of its Markov boundary nodes (i.e. the beliefs in the Cartesian product of their values). Thinking in terms of paths can obscure this. Consider the False Barrier BN illustrated:
When there is no evidence, the beliefs of A, B, C, and D are all 1/2. If we get evidence TRUE for A, the beliefs of B and C remain at 1/2, but the belief at D changes to 3/4. Thinking in terms of a constraint network, or "flow of influence along paths," it is hard to see how a change at A can create a change at D without changing the beliefs at B or C. Of course, it is the joint belief in B and C which have changed (BEL (+b+c) changes from 1/4 to 3/8, BEL(+b-c) changes from 1/4 to 1/8, etc). Therefore, we must be careful with the path concept.
Paper link: <www.norsys.com...>
Europe Map CSP
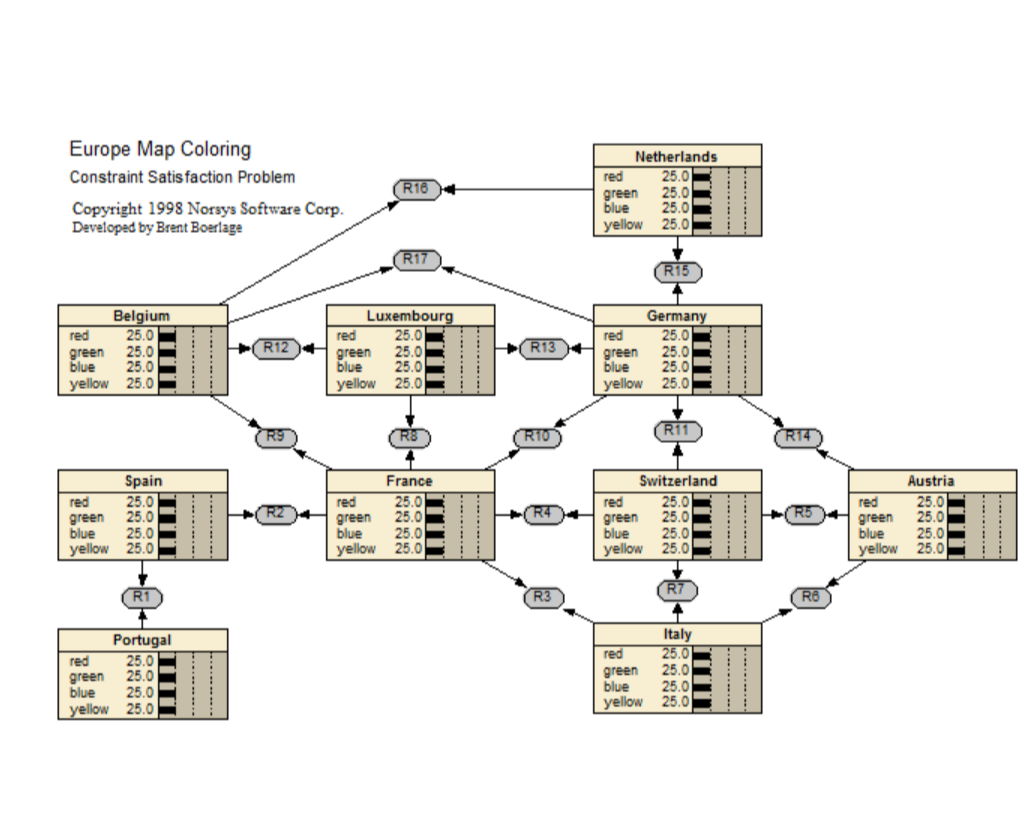
This Bayes net demonstrates how to solve constraint satisfaction problems (CSPs) using Bayes nets. A CSP consists of a number of variables, and some constraints between them. The goal is to find values for the variables that satisfy all the constraints.
Paper link: <www.norsys.com...>
Classifier Optimization
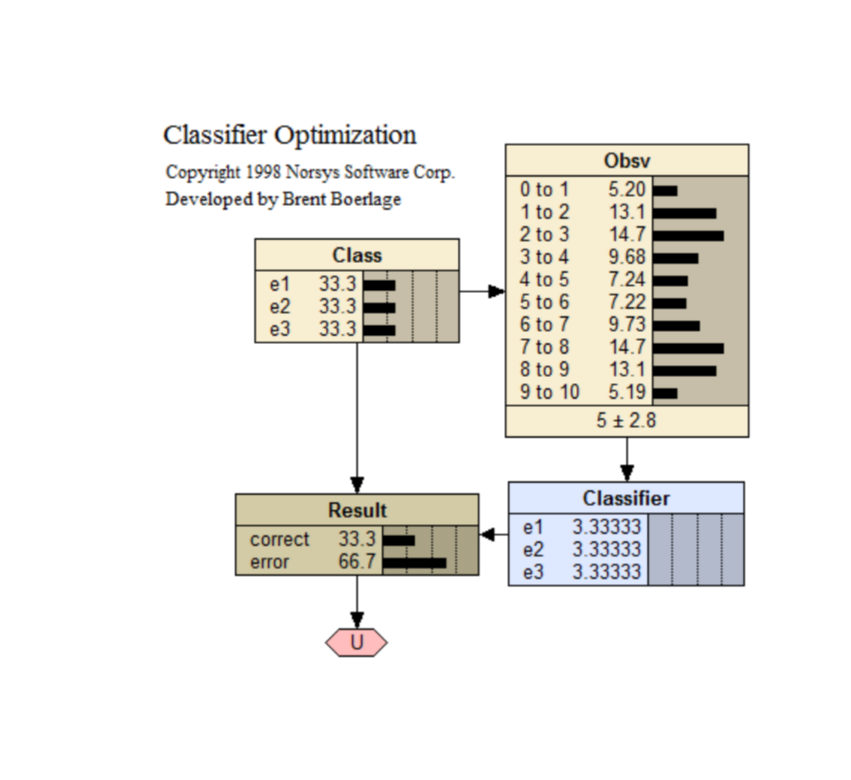
A BN classifier.
An explanation of this BN can be found at <www.norsys.com...>
Paper link: <www.norsys.com...>
Central Limit Theorem
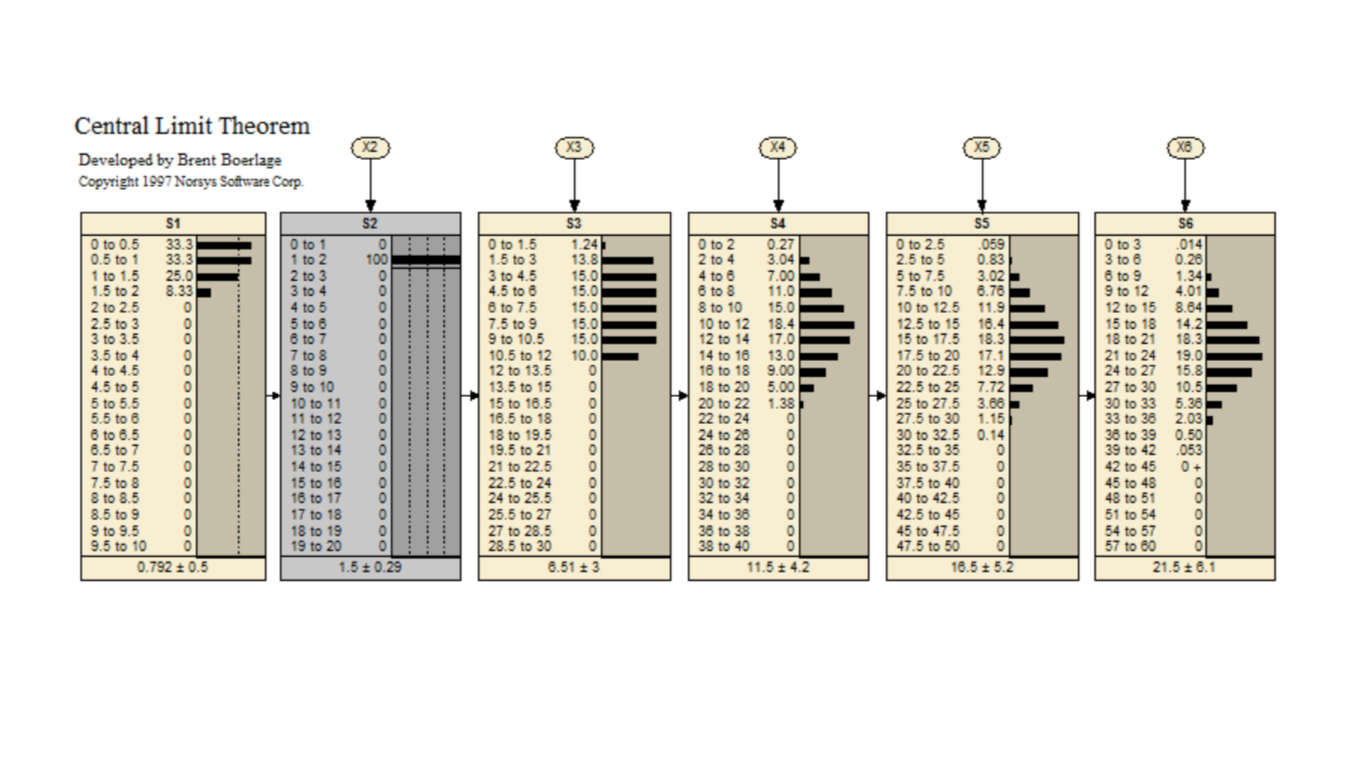
This Bayes net is to demonstrate the Central Limit Theorem.
Paper link: <www.norsys.com...>
Car Diagnosis2
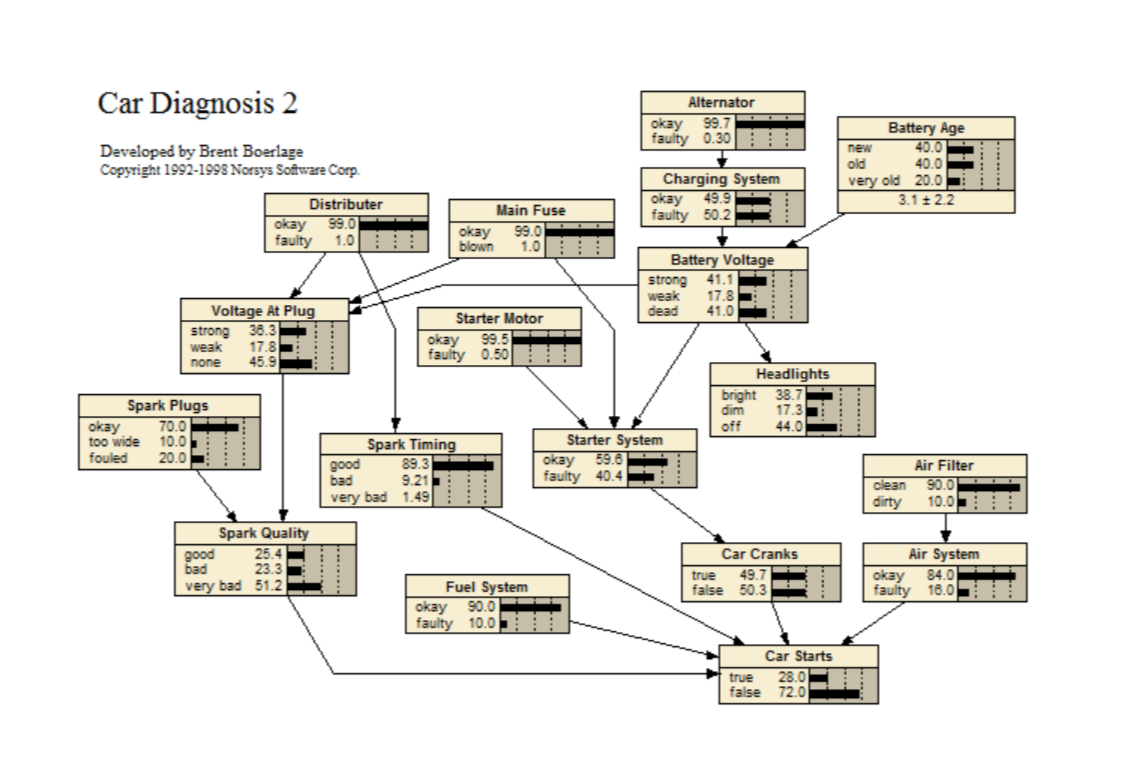
A simple example belief network for diagnosing why a car won't start, based on spark plugs, headlights, main fuse, etc. This example is small and just calls out to be expanded.
BN link: <www.norsys.com...>
Bouncing
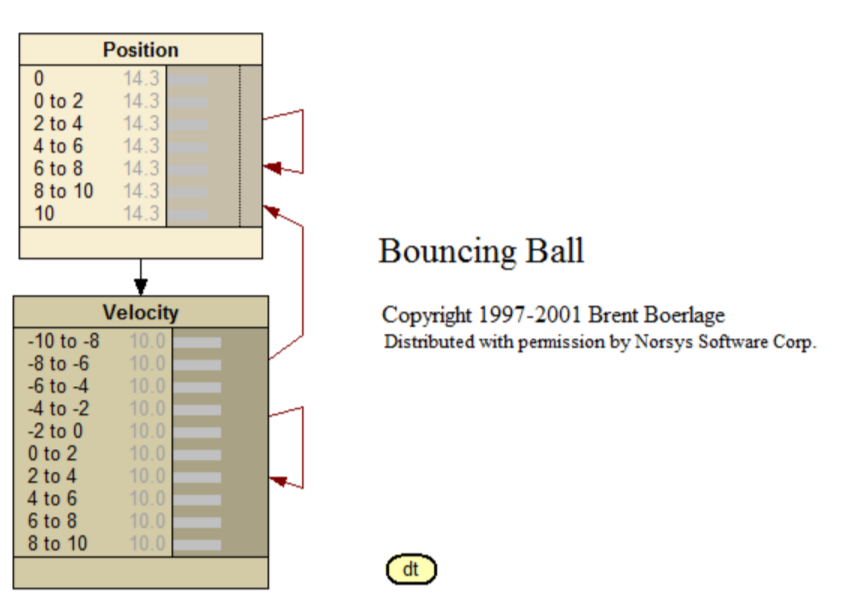
A time delay belief network for the position and velocity of a friction-less 'ball' bouncing between 2 barriers. More information: <www.norsys.com...>
Book Bags
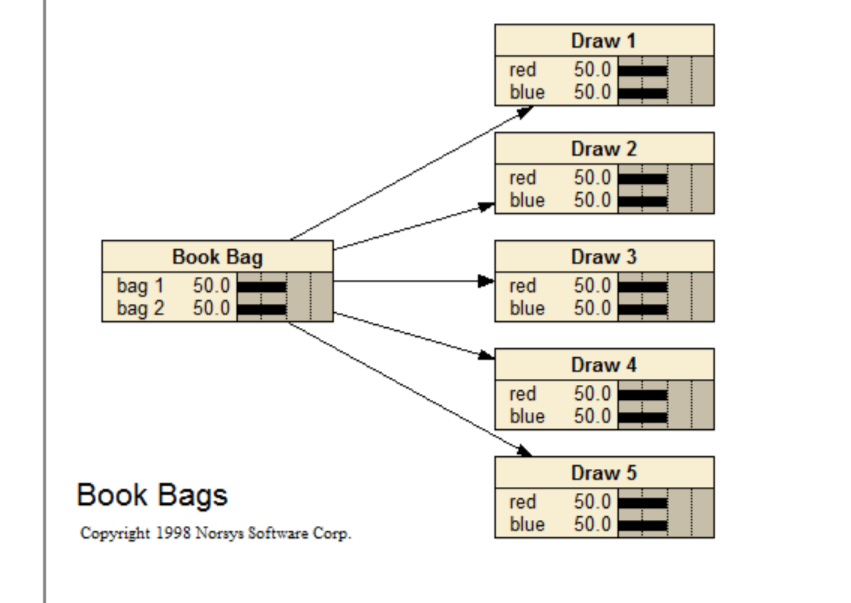
There are two book bags each containing 10 poker chips. In one bag there are 7 red and 3 blue. In the other bag there are 3 red and 7 blue. Five chips are drawn out of one of the bags and shown to the subject (one at a time then returned to the bag). The subject does not know which bag the chips came from. There is an equal chance that the draws are made from either bag. After each draw the subject reports which bag he believes the chips are coming from and provides a probability that the chips are being drawn from that bag.
The problem comes from the early "revision of judgment" work that indicated that people were conservative with respect to Bayes.
Boerlage92
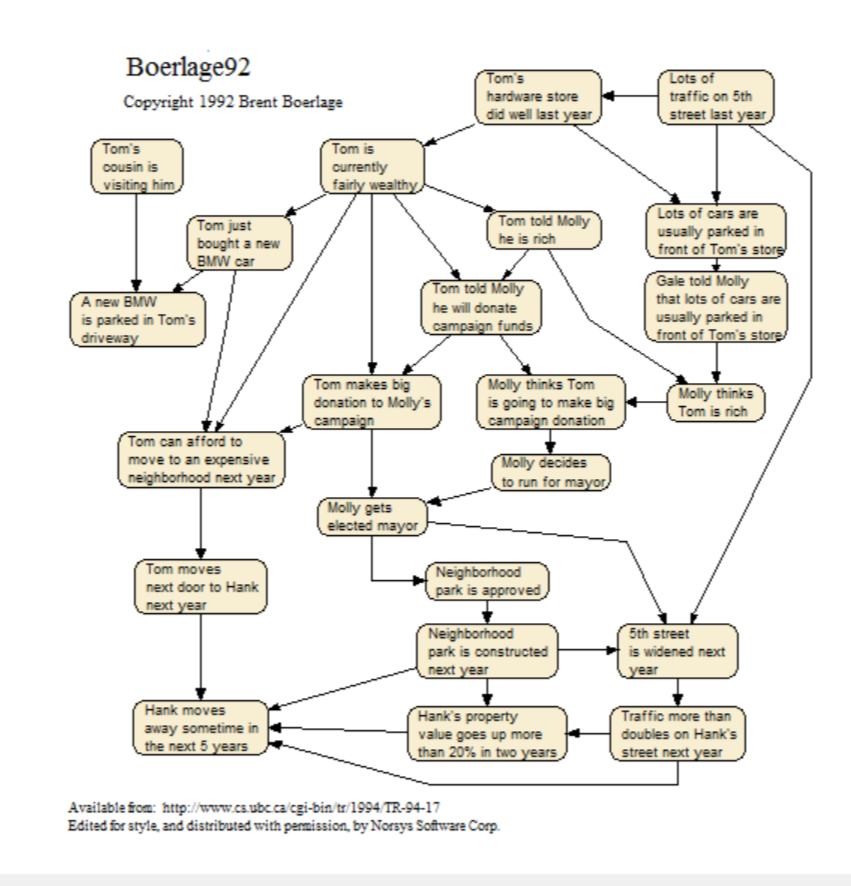
A subjective belief network for a particular scenario of neighborhood events, that shows how even distant concepts have some connection. More information: <www.norsys.com...>
Polar Bear Stressor Model, Phase II (2016)
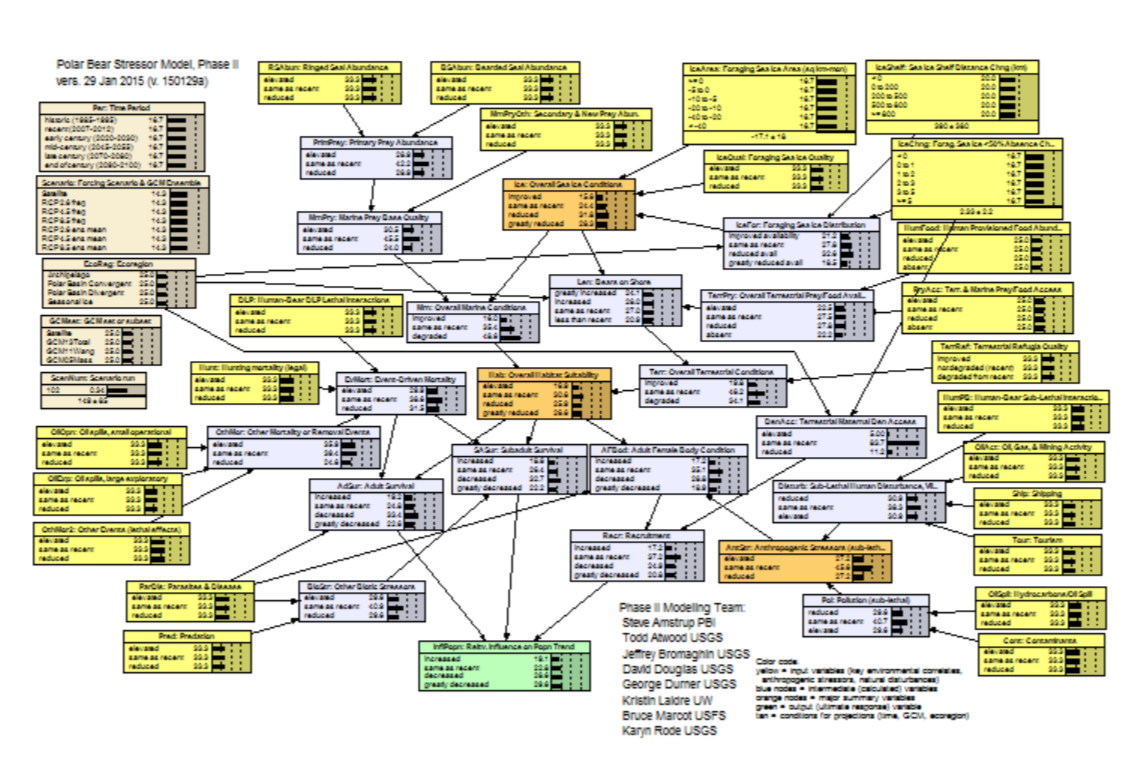
The polar bear (Ursus maritimus) was listed as a globally threatened species under the U.S. Endangered Species Act (ESA) in 2008. We updated a Bayesian network model (available at <abnms.org...>) previously used to forecast the future status of polar bears worldwide, using new information on actual and predicted sea ice loss and polar bear responses, to evaluate the relative influence of plausible threats and their mitigation through management actions on the persistence of polar bears in four ecoregions. Overall sea ice conditions, determined by rising global temperatures, were the most influential determinant of population outcomes which worsened over time through the end of the century under both stabilized and unabated greenhouse gas (GHG) emission pathways. Marine prey (seal) availability, linked closely to sea ice trend, had slightly less influence on outcomes than did sea ice availability itself. Reduced mortality from hunting and defense of life and property interactions resulted in modest declines in the probability of a decreased or greatly decreased population outcome. Minimizing other stressors alone such as trans-Arctic shipping, oil and gas exploration, and contaminants had a negligible effect on polar bear outcomes. A case file for the model can be found here: <abnms.org...>.
The Phase I Polar Bear Stressor Model can be found here: <abnms.org...>
Beta Updating
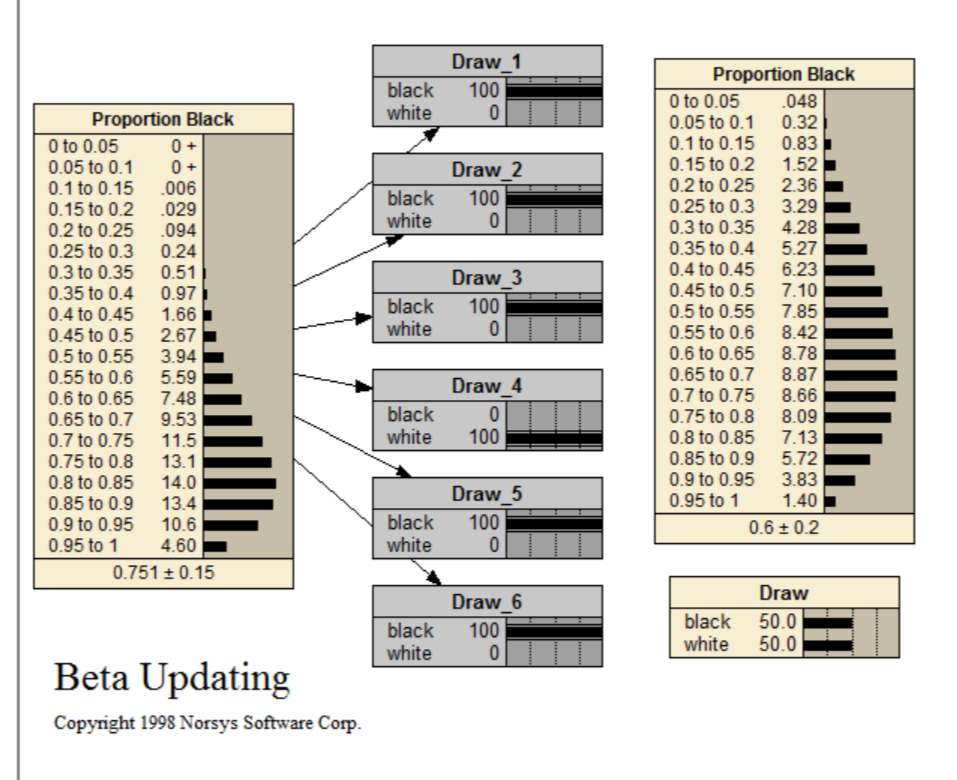
This problem is about how to determine the proportion of white and black balls in a bag. In order to do this, you draw a ball or several balls from the bag and replace them. This can be repeated several times.
This network is also available at <www.norsys.com...> See the tutorial <www.norsys.com...> for more details.
Berkeley Admissions
A demonstration of Simpson's Paradox (also available at <<www.norsys.com...> An explanation of this BN can be found at: <www.norsys.com...>
Animals
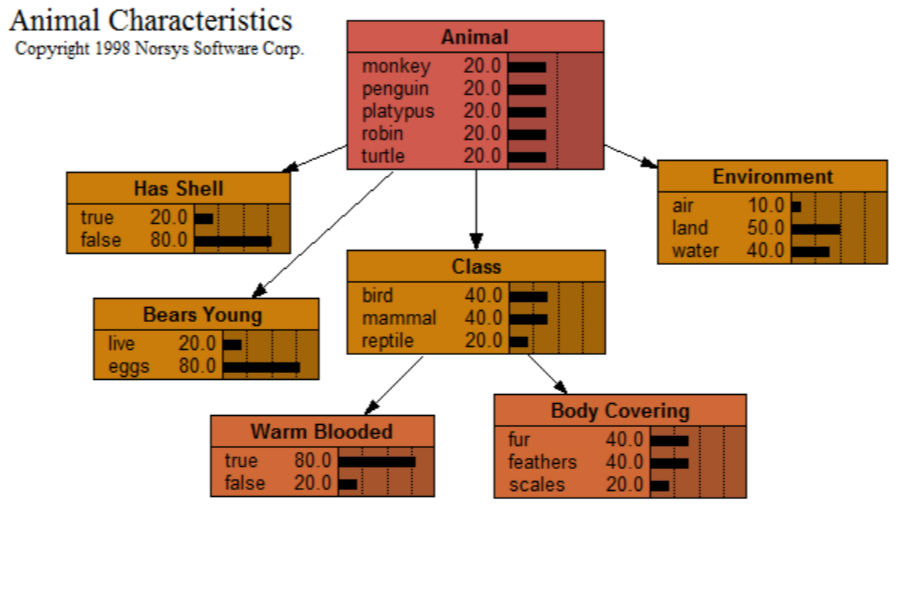
With this network (also available from <www.norsys.com...>) you can enter some characteristics of a particular animal, and watch how the probabilities of its other characteristics (and what type of animal it is) change.
This is just a toy example. For a real-world application, it would have to be extended to include many animals (or plants, bacteria, etc.), probably all from the same environment, or the same subclass, etc. Also, the "Animal" node should probably have an "Other" state.
The fun part of this network is to extend it to include more animals and more characteristics. You may need to define other groupings, such as the "Class" node, in order to keep things manageable. If you make a great network, send it to Norsys; we would love to include it in our library (with the proper credits).
 Bayesian Intelligence